Florida and Texas are the new and improved Sweden: short shutdowns work best
From March to early May 2020, the U.S. caught up on ventilators, PPE, and testing.
In May there was a juncture: continue the “flatten the curve” strategy, or attempt to suppress the virus with an extended shutdown.
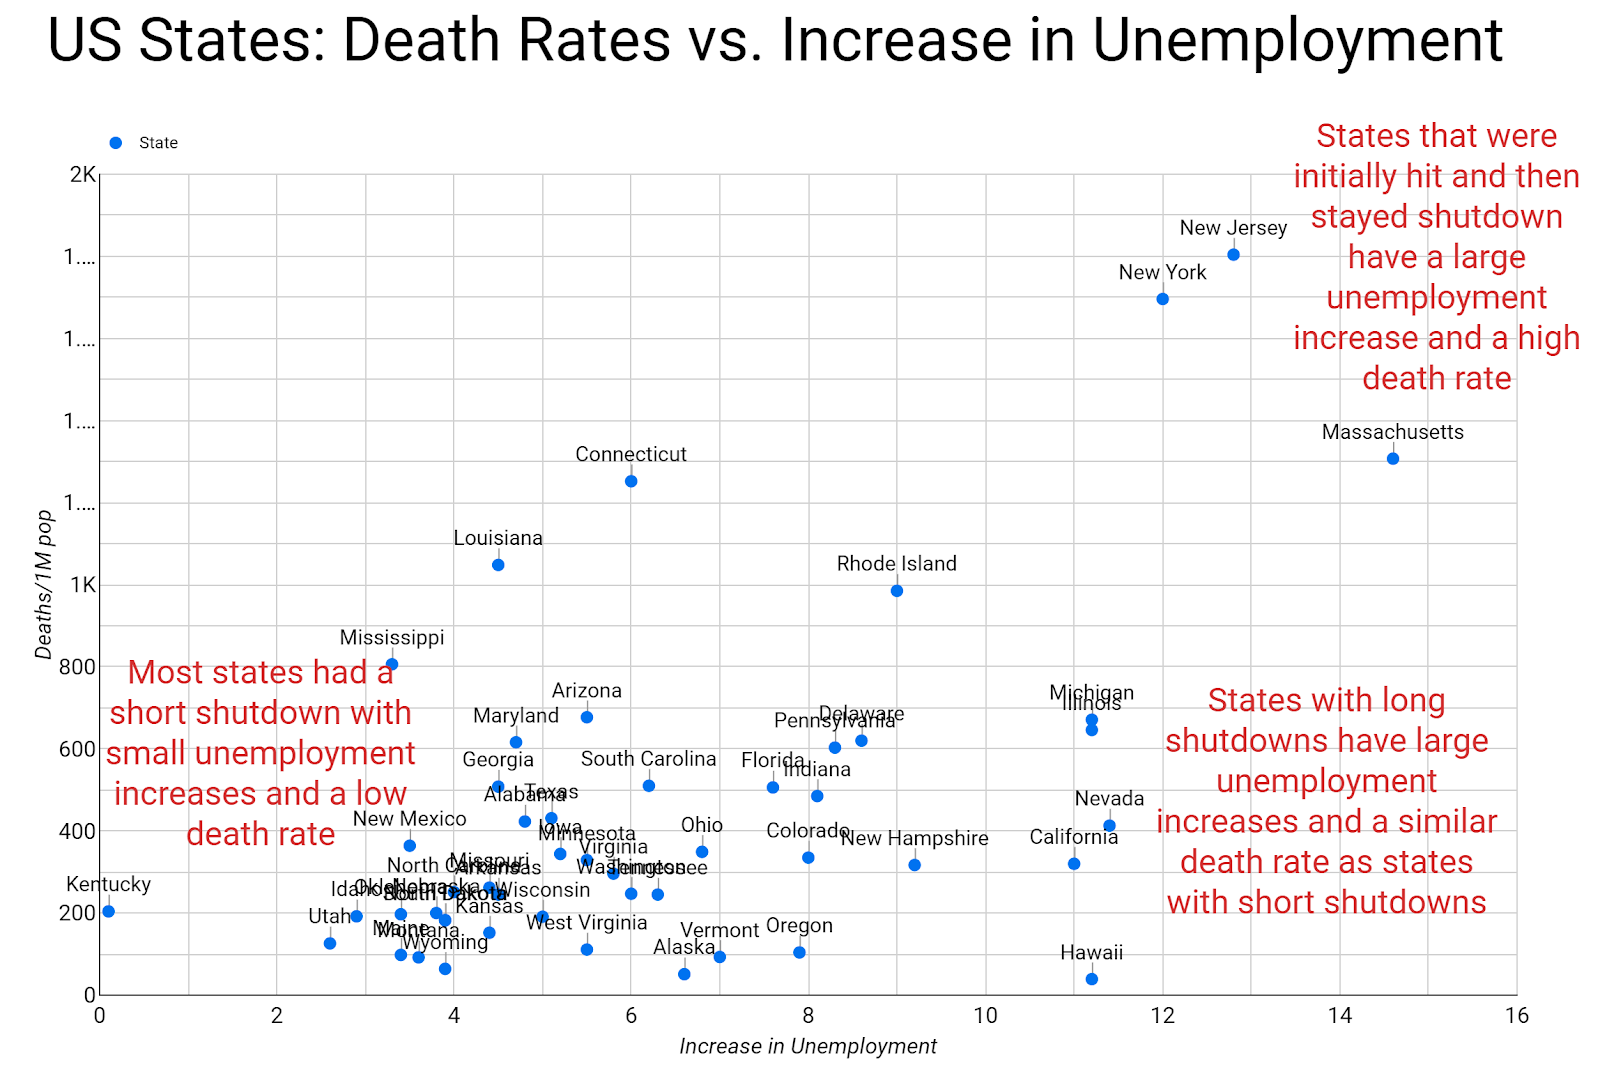
States that continued with the “flatten the curve” strategy and re-opened had a lower unemployment increase and a similar death rate as states with extended shutdowns.
The U.S. coronavirus response was much looser than most European and Asian countries, many of whom had strict shutdowns where people could rarely leave their homes. Within the U.S., there were various responses between states, ranging from no business closures to significant and long-lasting closures. As we near the sixth month of the U.S. pandemic response, we can analyze the efficacy of different approaches. In particular, whether the length and breadth of a shutdown helped reduce per capita deaths, and at what economic expense.
The U.S. shutdown to “flatten the curve”
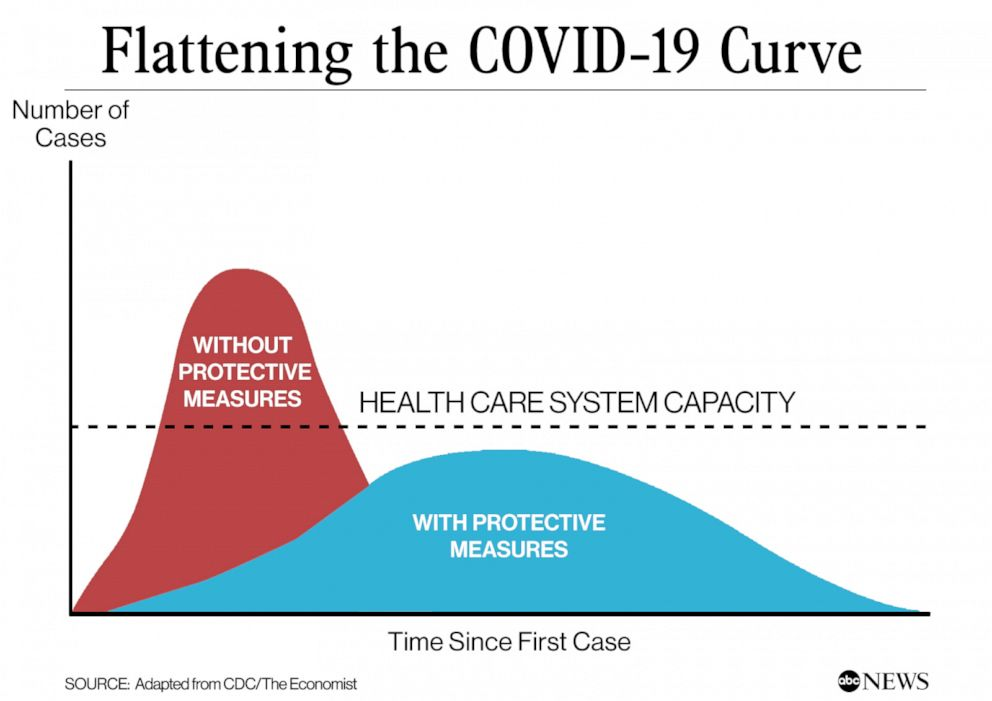
The U.S. government is widely criticized for not locking down quickly enough or implementing a quick response similar to those of Asian countries with SARS experience. As the outbreak intensified in New York City, the U.S. instituted a federally mandated slow down for 15 days from March 16 to March 31, followed by an additional 30 days from April 1 to April 30. Various jurisdictions surpassed federal guidance with shelter-in-place and business closures. The shutdowns’ stated goal was to “flatten the curve” to prepare for and slow down a wave of sickened people so that everyone who needed a hospital bed or ICU would get one.
The messy rush for ventilators, PPE, and testing was mostly solved by May
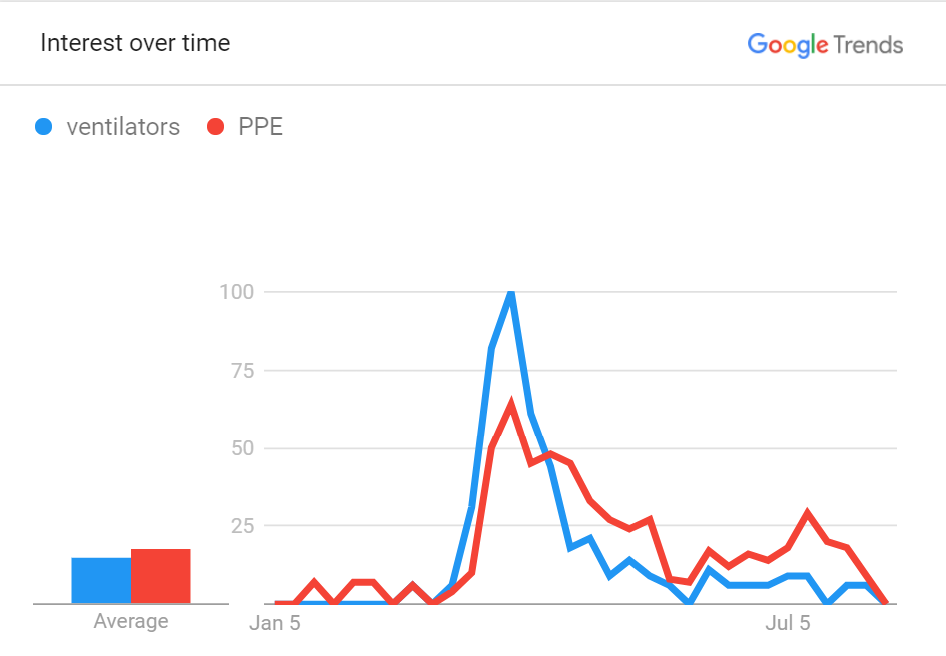
What happened from March to May was very messy. Computer models from Imperial College and IHME predicted a massive spike in cases and a corresponding shortage of ventilators. The predicted shortages triggered an enormous scrum between governments and private industry to obtain ventilators and PPE (Personal Protective Equipment). There is the complaint that the U.S. should have created a single government coordination point to obtain and distribute ventilators and PPE, qualify requests, and set up a distribution mechanism. Instead, the government decided to let the free market reign and have organizations purchase these goods through whatever channels necessary. Although quite messy, the approach worked; the need for ventilators and PPE peaked at the beginning of April and subsided through May, helped by the fact that fewer ventilators were needed than predicted. In early May, the U.S. had excess capacity and was shipping ventilators to other countries in need of the medical equipment.
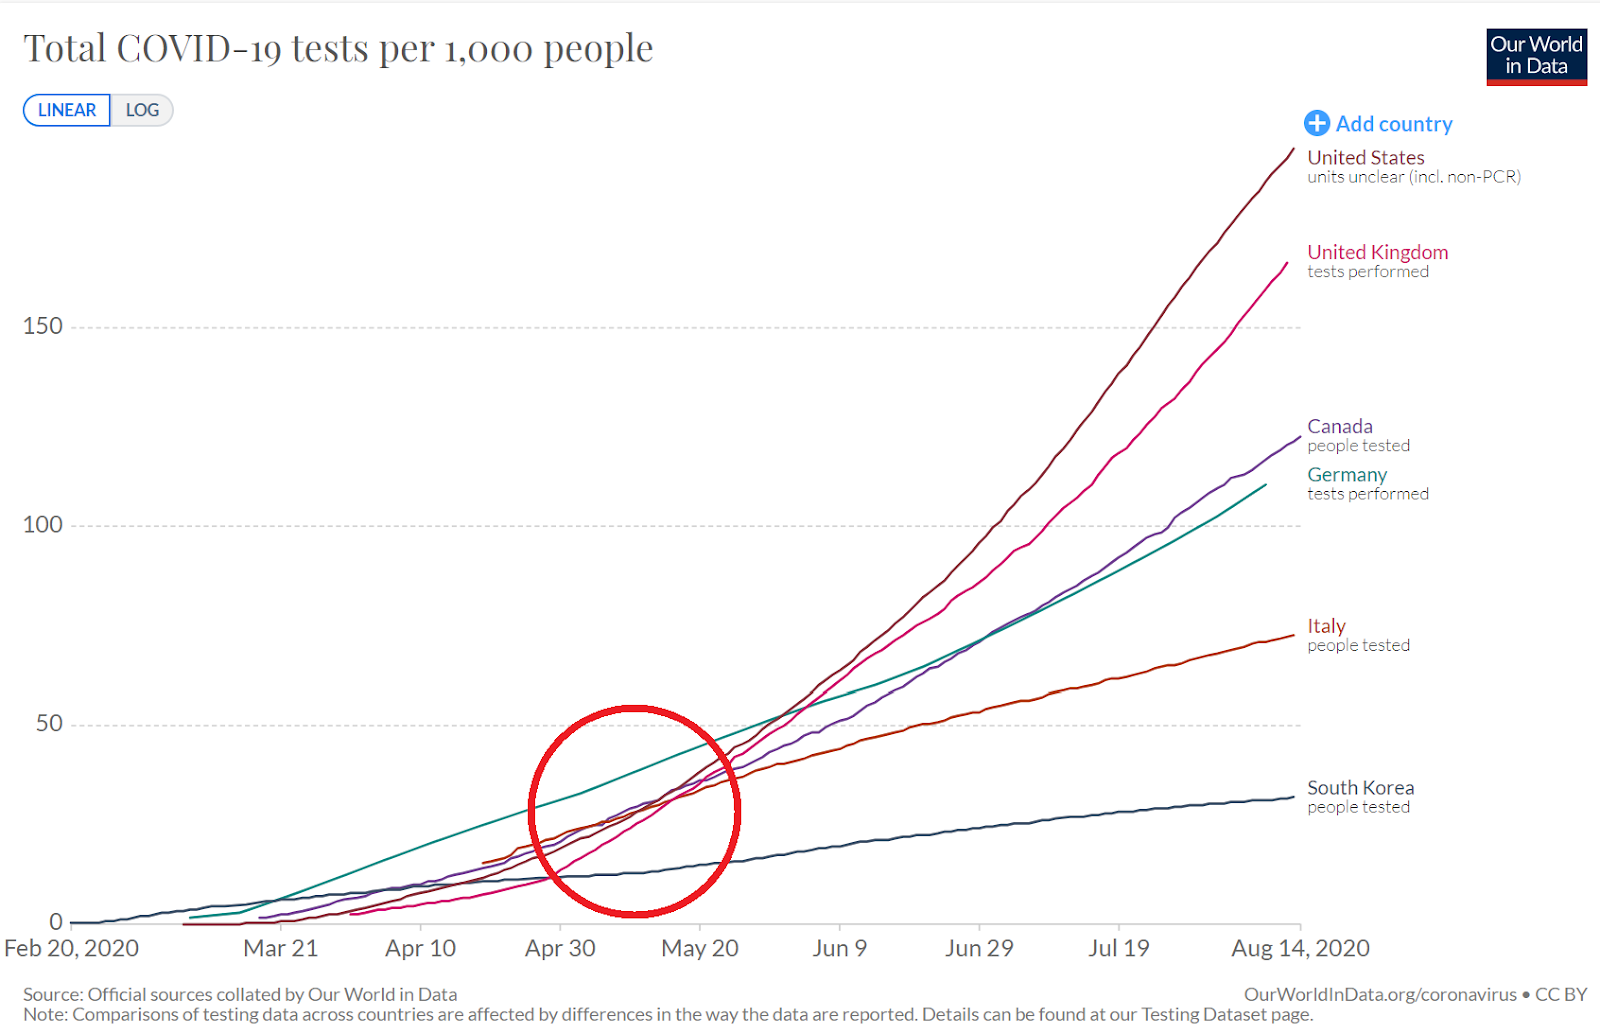
Another debacle was the need for more testing. The U.S. Centers for Disease Control (CDC) had a longstanding policy that only the CDC can create new viral tests from scratch and distribute the test to industry. The CDC was a single point of failure that did indeed fail, causing another scrum to catch up in testing. The U.S. did not begin to catch up with its peer Western nations until the beginning of May. The testing system continues to be stressed by delays in processing. However, tests for frontline workers and those with symptoms are prioritized over other tests and are generally processed quickly. U.S. testing capacity continues to increase, leveraging its fee-for-service medical system’s endless capacity to test any number of ailments.
The May divergence: continue with the “flatten the curve” strategy or commence a virus suppression strategy
At the beginning of May, the U.S. had begun to resolve ventilator shortages, PPE shortages, and caught up in testing. Elderly and vulnerable populations were well educated, and long-term care facilities had time to institute new protocols. Early serology testing from around the U.S. and Germany showed a high number of asymptomatic cases and a relatively low infection fatality rate of 0.1%-0.4%, much lower than the 3%-5% case fatality rate of symptomatic patients. It was becoming clear that COVID-19 was not as fatal as previously thought in early models. Current CDC estimates show the infection fatality rate is 0.26%, two-and-a-half times that of the flu.
Option 1: Continue with “Flatten the curve”
The U.S. was at a juncture, and there was a divergence in strategy. The federal government and most states, including Texas, Florida, Arizona, and Georgia, wanted to re-open with the original “flatten the curve” strategy. This meant re-opening knowing that there would be a rise in cases, yet slowing the rise such that hospitals would not be overwhelmed. Business leaders recommended this strategy to prevent an economic calamity. The vast majority of epidemic planning for respiratory infections with an infection fatality rate lower than 1% recommended this approach.
Option 2: Suppress the virus
Other states such as New York, California, Michigan, and Illinois opted to remain closed and implement a virus eradication strategy. This strategy was implemented by emulating countries such as Australia, New Zealand, and most of Europe which implemented a virus suppression strategy with extremely strict shutdowns, contact tracing, and isolation. Many in the U.S. are very independent-minded, so there is a very low likelihood of success of implementing European-style military-enforced shutdowns, tracking peoples’ movement for contact tracing, printed out “hall passes” for one member of a household to go shopping per day, and pulling people out of their homes to put them into mandatory isolation. Most U.S. public health experts and the media backed the suppression strategy, although it was a novel strategy.
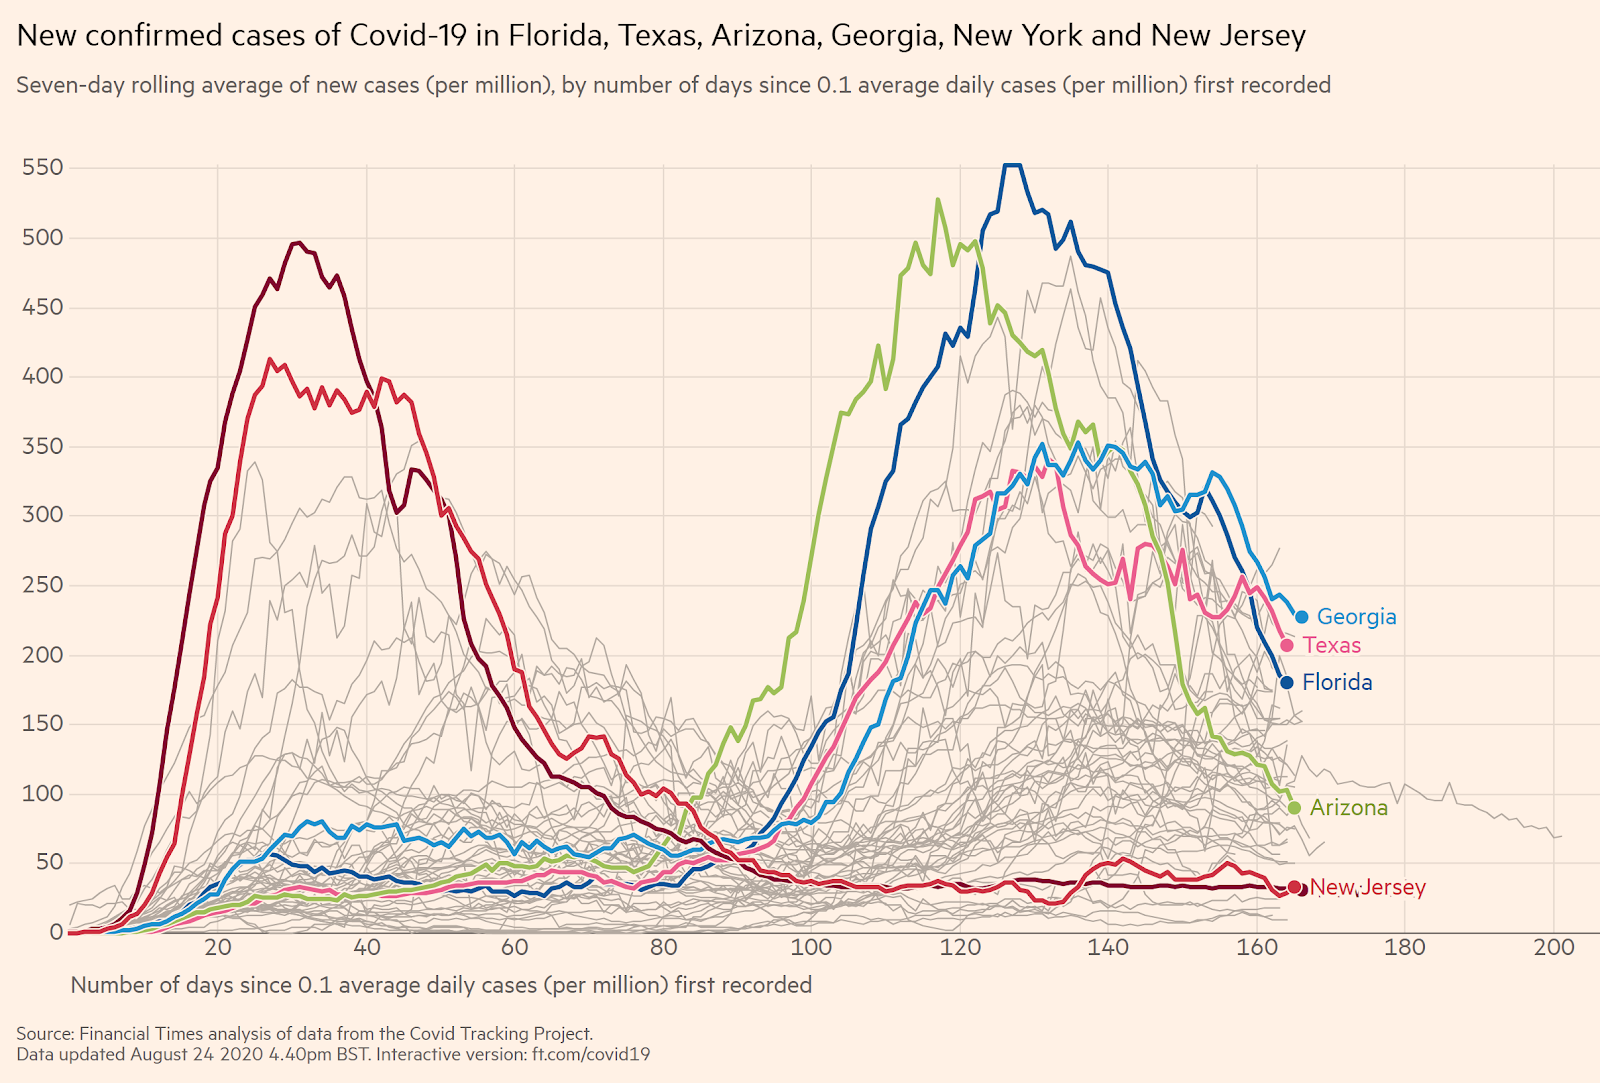
Re-opening spiked cases counts in Florida, Texas, Arizona, and Georgia
Georgia began to open up on April 24 (22-day shutdown), Texas on May 1 (28-day shutdown), Arizona on May 15 (45-day shutdown), and Florida on May 19 (46-day shutdown). Immediately after re-opening, the number of cases grew dramatically. Despite a media outcry, these states stayed the course, while adding some mitigation to “slow the spread” to ensure a flattened curve, like mask requirements and reclosing bars. The virus quickly reached an apex in these states and then quickly plateaued and subsided. The peak in per capita cases in Florida and Arizona were very close to the peak of per capita cases in New York and New Jersey, the hardest-hit U.S. states (and region of the world) that suffered the first U.S. outbreak. This time, most infected people were less than 60 years old, with a fatality rate similar to the flu. After the wave passes, the elderly and vulnerable can resume their activities.
With large case spikes, there are concerns about long-term heart, lung, brain. and kidney problems that are the rare but typical symptoms of viral inflammation. Each new report about these outcomes seems to use small sample sizes and then gets debunked and fade away.
“Flatten the curve” worked in Florida, Texas, Arizona, and Georgia
“Flatten the curve” did indeed work. Graphically comparing these four early-opening states to New York and New Jersey looks precisely like the CDC “flatten the curve” example, other than the curve is flatter than expected. Hospital capacity in these states was stressed but not overwhelmed. Nursing homes and elder care were relatively secured. Patients sometimes did not have a room available, yet every patient that needed an ICU or treatment received it. In rural Texas hospitals without ICUs, there were indeed tough decisions for terminal patients whether to be sent to an available bed thousands of miles away or home to hospice care.
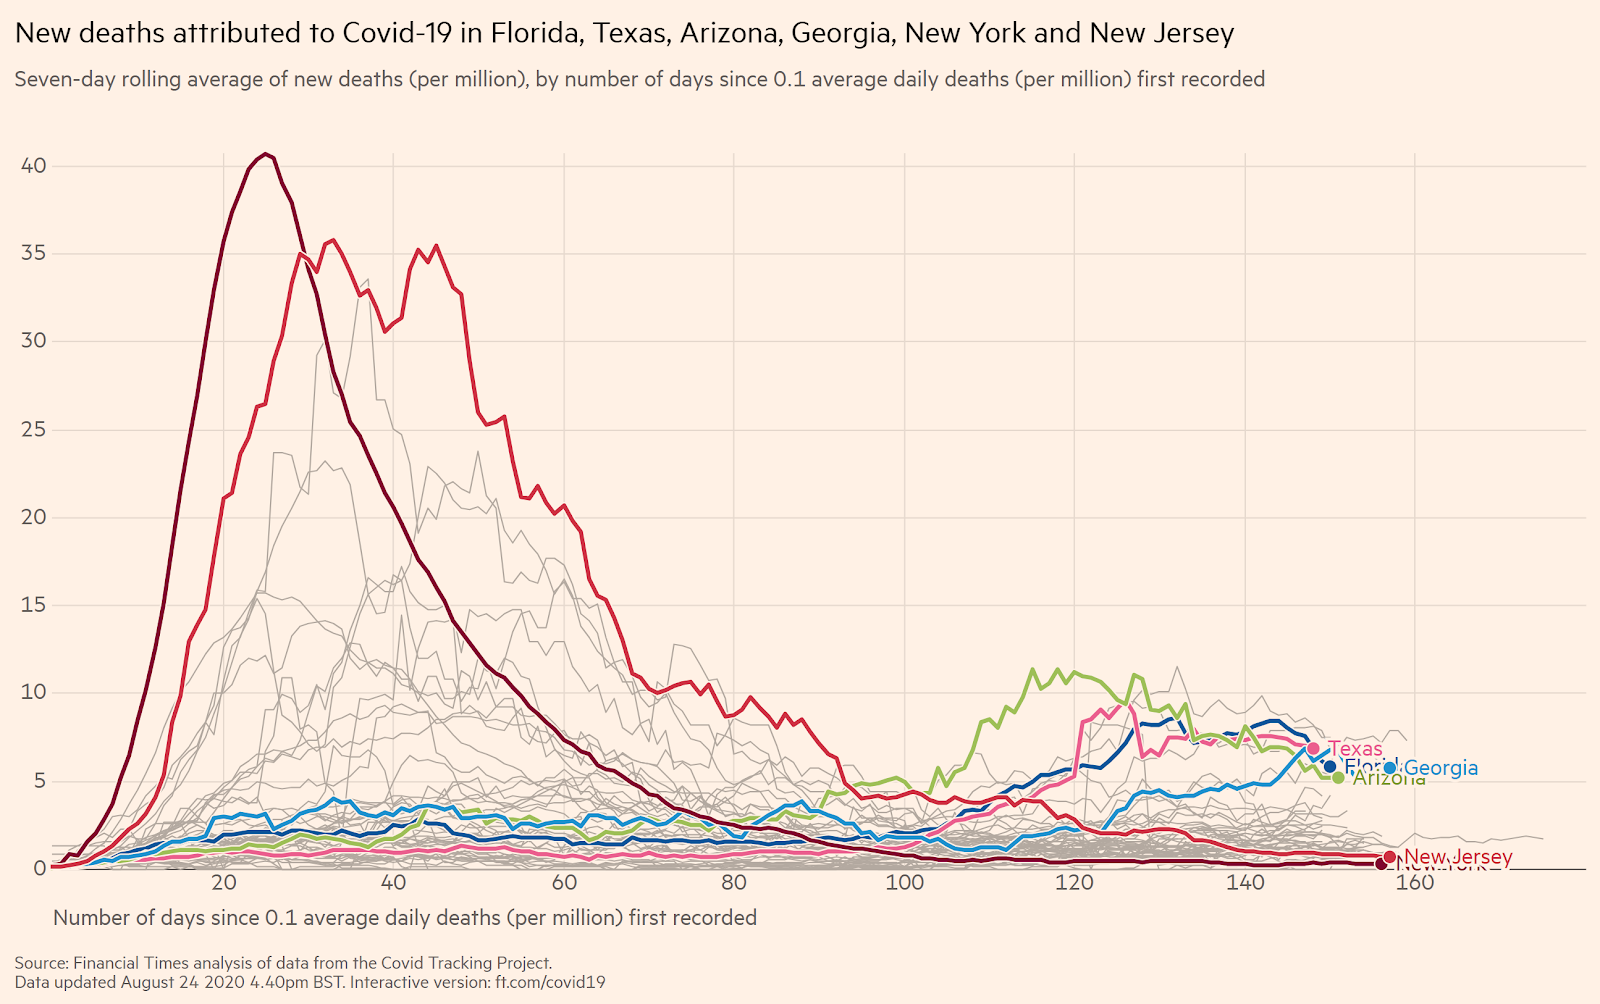
The difference in taking 4-6 weeks to secure the vulnerable population and prepare the hospital system for a spike in cases is very apparent. Texas is the second most populous state with 29 million people and has had 12,000 deaths after re-opening. Florida is the third most populous state with 21 million people and has had 11,000 deaths after re-opening. These are far fewer deaths than predicted and far fewer deaths per capita than states that shutdown for far longer. There are estimates that up to 2/3 of those deaths were people that would have died in the next six months. To put these unfortunate deaths into context, Texas has 198,000 deaths and Florida has 203,000 deaths every year. During the 2017-18 flu season, Texas had a comparable 11,000 flu deaths.
Comparing death rates and economic consequences of mitigation vs. suppression
States like Florida, Texas, Arizona, and Georgia were shut down for 3-7 weeks, which had a profound effect on their economies. However, they have half the unemployment increase of states with extended shutdowns like Michigan, Illinois and California. Florida, Texas, Arizona, and Georgia also have a lower per capita death rate than the states with extended shutdowns. States like New York, New Jersey and Michigan that were hit at the beginning of the pandemic have a high death rate, and a large unemployment increase because they stayed shutdown. [Note these charts use last month’s Bureau of Labor Statistic’s numbers because this month’s numbers are undergoing some debate and will likely be updated.]
Of particular contrast are California and Washington, both part of the “Western States Pact,” both experienced early COVID outbreaks and early shutdowns. The most populated regions of California have maintained shutdowns far longer than other states and municipalities. Fitness centers, hair salons, and bars have been closed in swaths of the state for over five months, and a great deal will likely not survive.
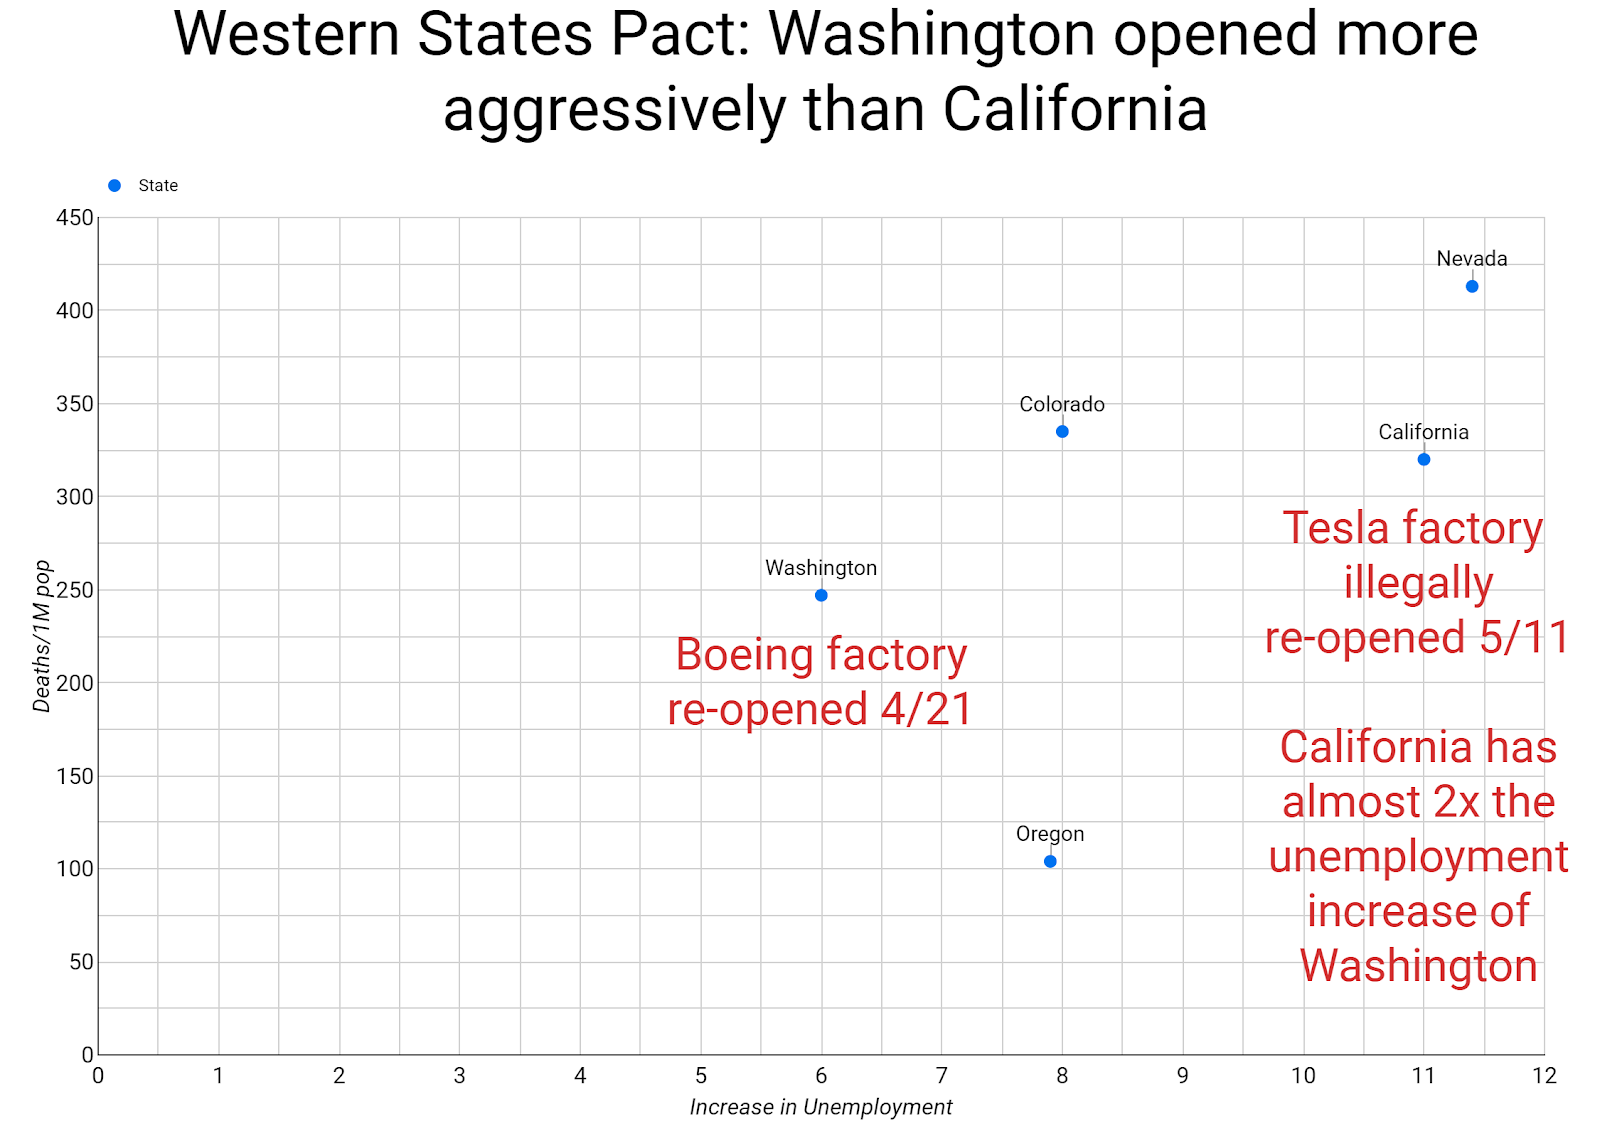
Tesla illegally re-opened its California factory on May 11 to force the issue and then was able to legally re-open. Washington, also part of the “Western States Pact,” has been much more aggressive, allowing Boeing to restart manufacturing on April 21 with safety protocols. Both Washington and California have the same per capita death rate. Yet Washington has only a 6% increase in unemployment and California has an 11.5% increase in unemployment. California has the same per capita death rate as Washington, but twice the unemployment rate. Pragmatic Germany did not close its factories and simply instituted safety protocols.
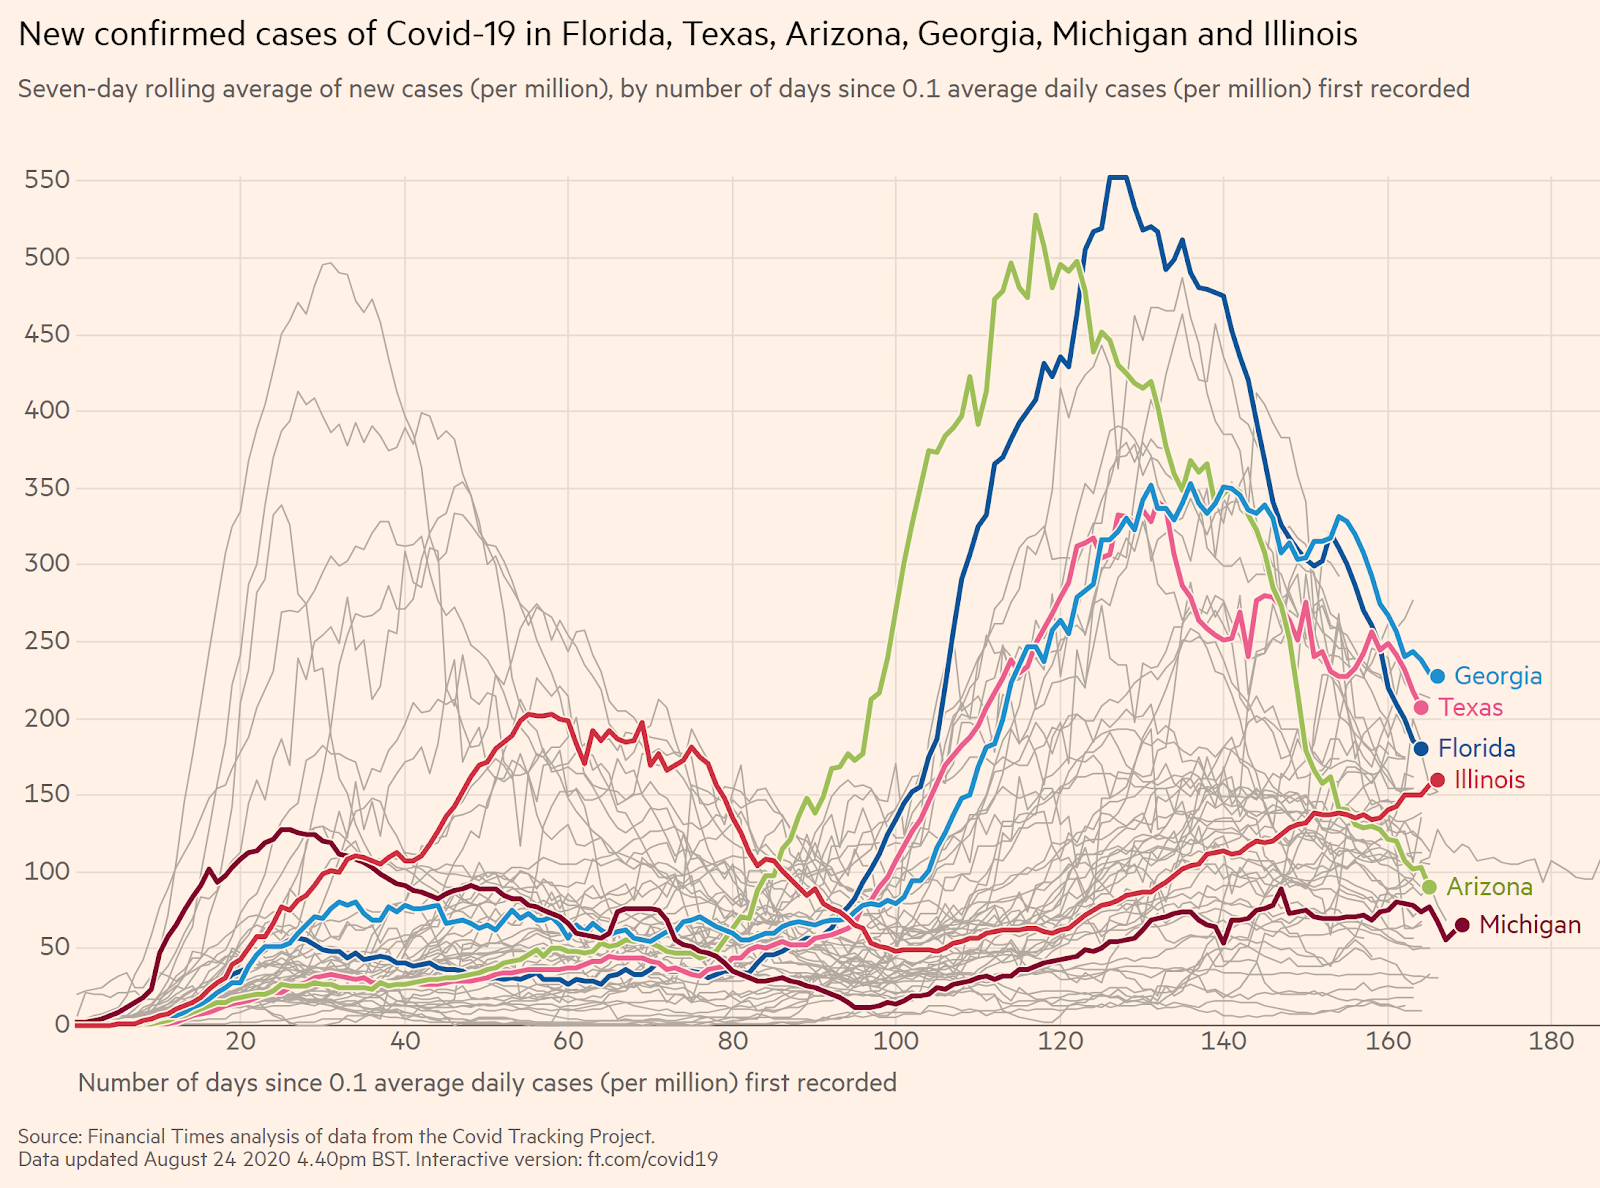
The virus comes back after re-opening, no matter how long the shutdown
It is becoming apparent that the cases start to climb again no matter how long a shutdown. Once a country or state re-opens, the cases come back. Michigan and Illinois, two states with long shutdowns, have cases that are steadily rising during their gradual reopenings and scalebacks. Arizona already has fewer new cases than these two states, and Florida, Texas, and Georgia will soon also outperform Michigan and Illinois. All six states have similar per capita death rates in the 500-650 per million range.
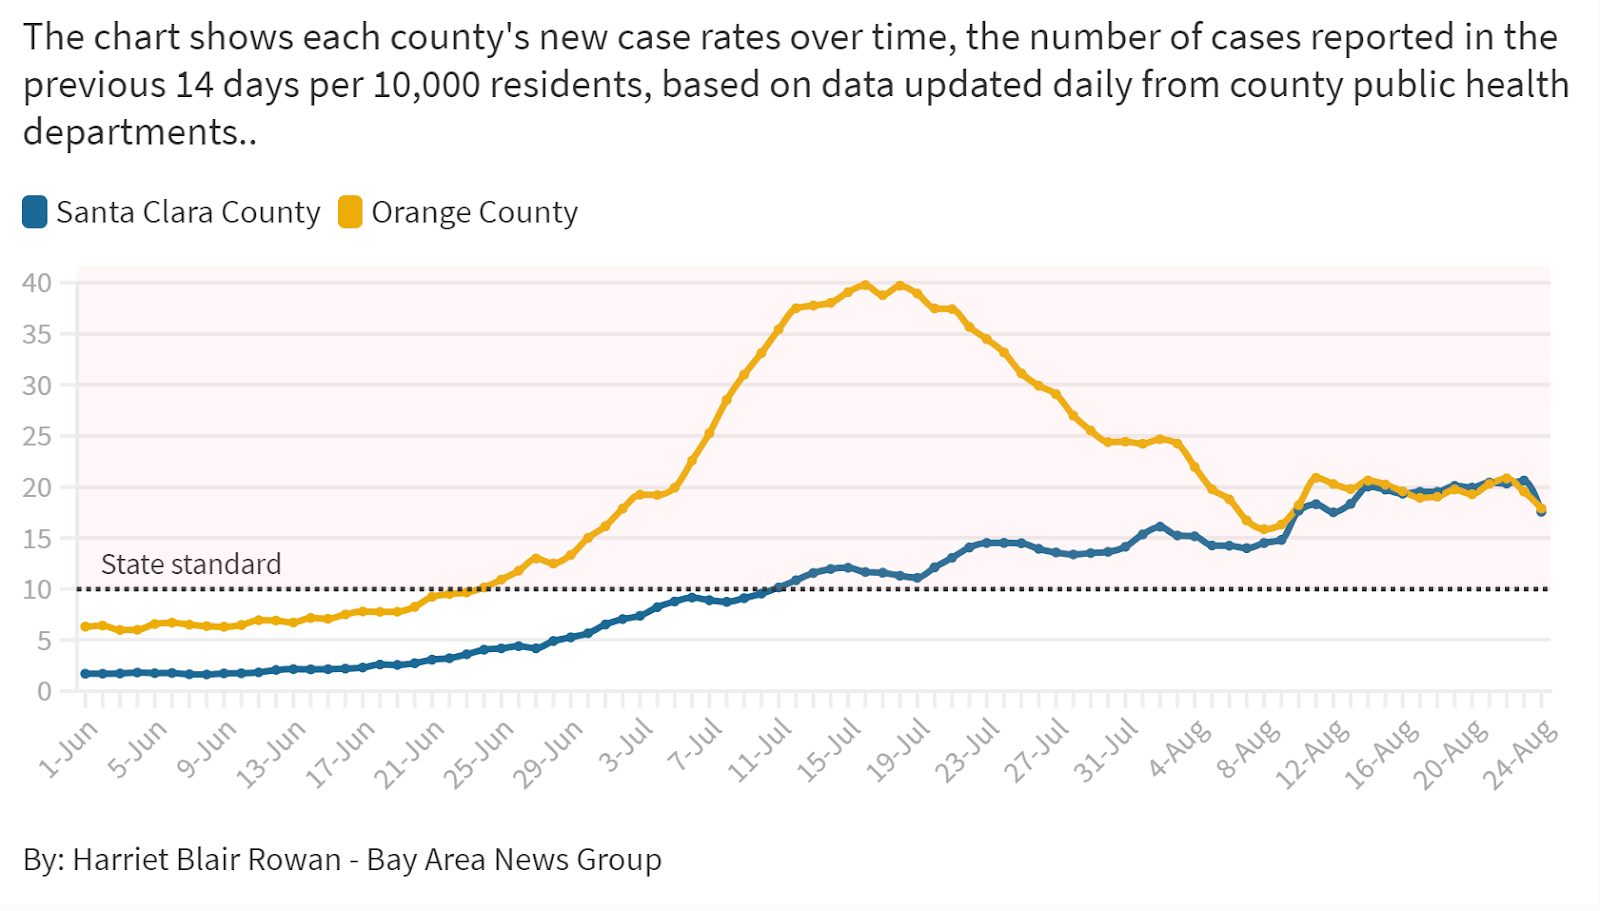
Places with short shutdowns outperforming long shutdowns is also happening within California. Santa Clara County, which had a very strict shutdown and citizen compliance, now has the same case counts as Orange County, which opened up as fast as it could and residents were highly resistant to mask guidance and beach closures.
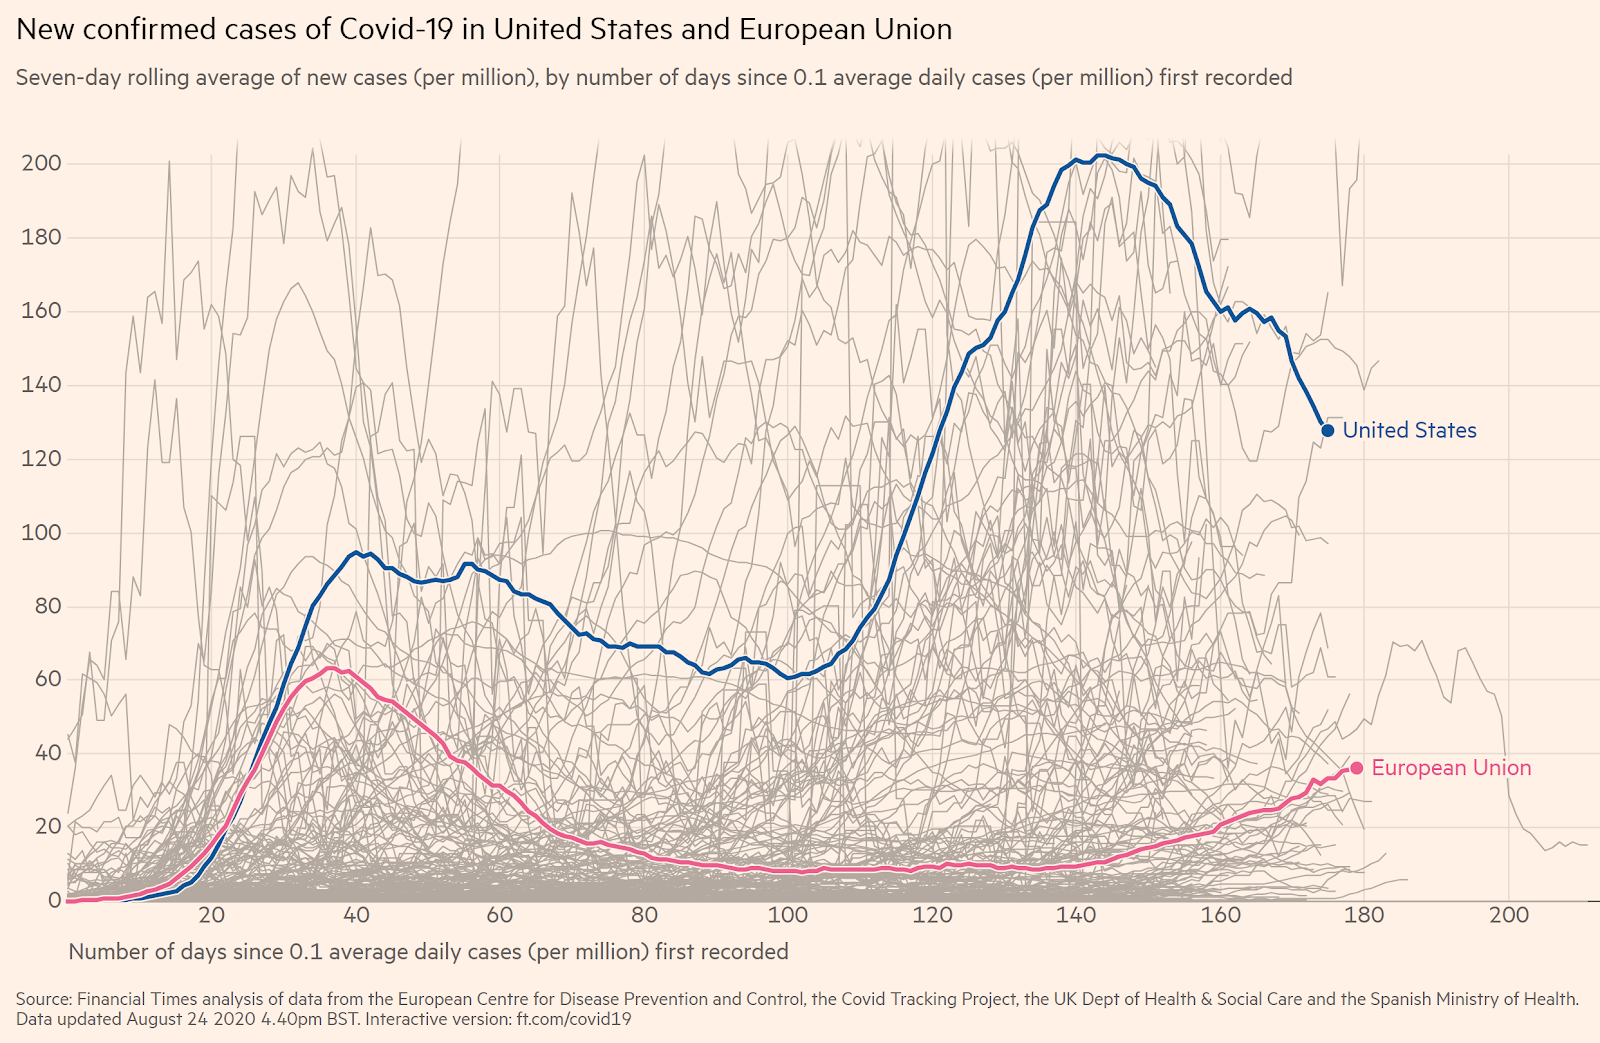
The trend is very apparent in the E.U., where countries had very strict lockdowns lasting months. After re-opening, several countries are seeing spikes, including Spain, France, Germany, the United Kingdom, and others. Most profound is Spain, which had a strict, three-month lockdown, only to re-open to a rapidly growing case count in the Catalon region where the virus had not previously taken hold. The U.S. had a much looser shutdown and the virus has run its course through the U.S.'s most populous states, so case counts are now falling the U.S. while they are rising in the E.U. Many E.U. countries have stated that despite rising cases that they will not re-introduce lockdowns.
The super lockdown and contact tracing countries still have spikes
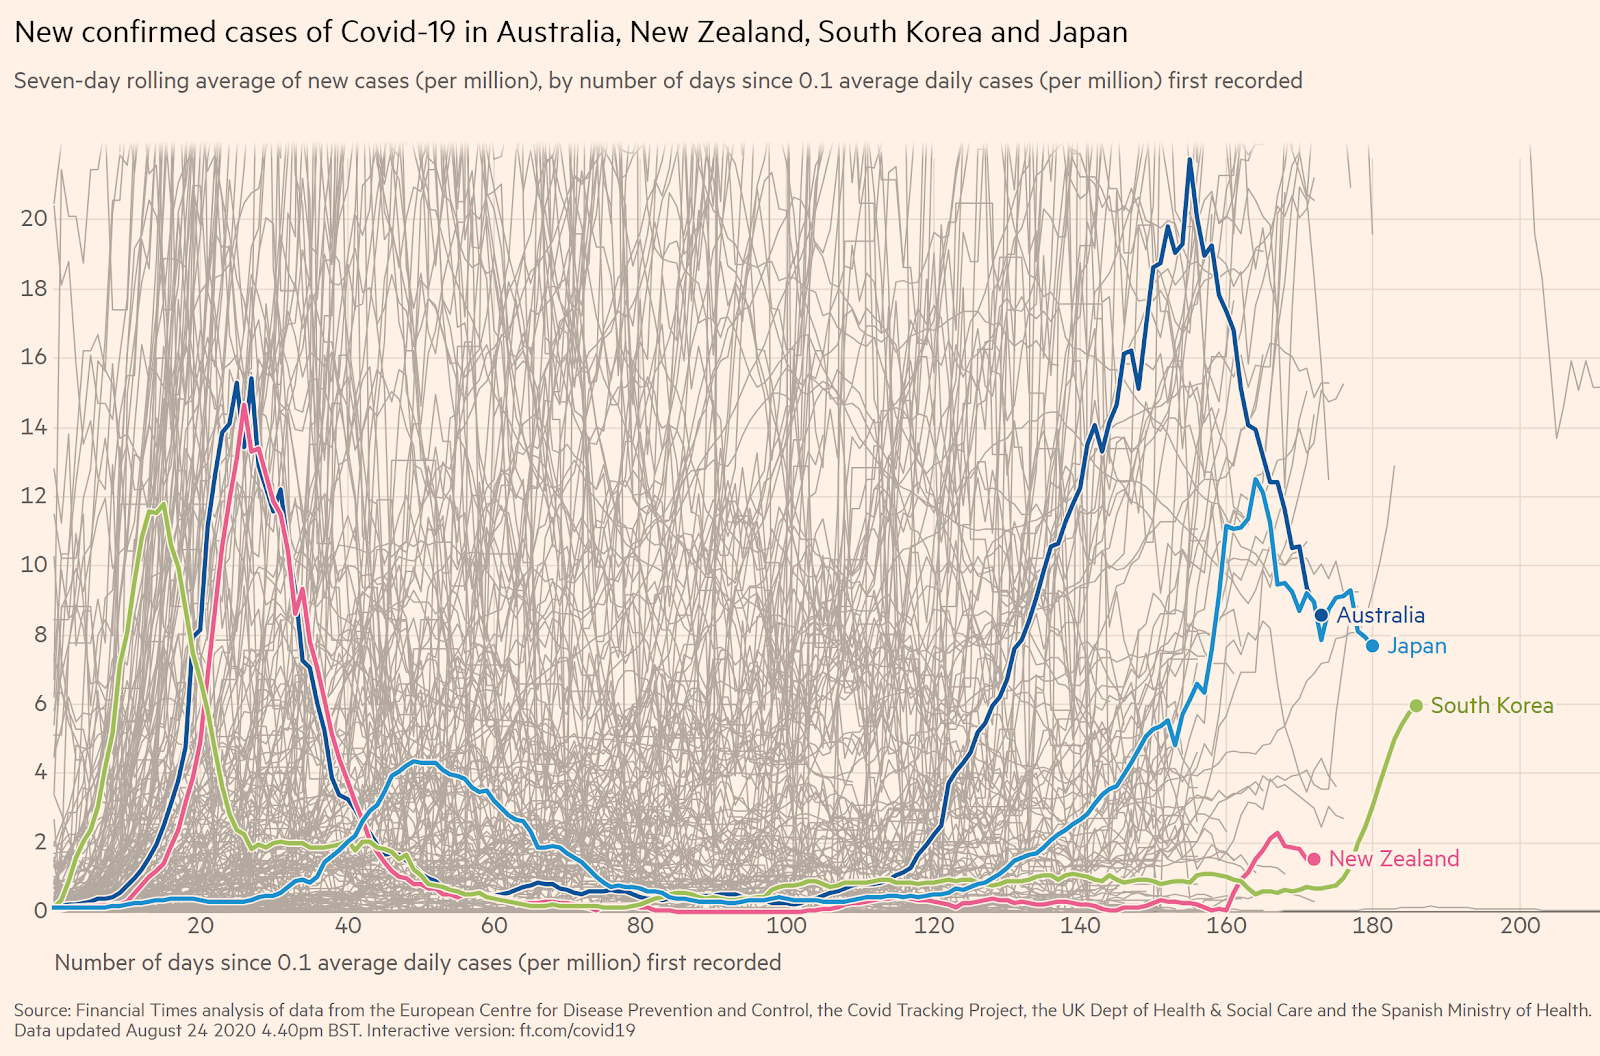
In spite of extended and strict lockdowns, even countries that were the epitome of the suppression strategy - New Zealand and Australia - are seeing new spikes and have to lockdown entire regions again. They will likely still succeed; a country with closed borders and a compliant population can indeed eradicate the virus with continual sieges. However, those countries will likely be isolated from the world until there is a vaccine.
There is a retrospective hope that an early lead in testing combined with contact tracing could have suppressed the virus. Testing and contact tracing was a successful strategy in Taiwan and somewhat successful in South Korea, which has experienced several flare-ups and is now on the verge of a major outbreak. Upon re-opening, Western countries like Germany and Spain that had months to prepare testing infrastructure and contact tracing still have wide community spread. Given the European re-opening experience and South Korea’s recent issues, it is doubtful that a testing and contact tracing strategy would have been effective in containing the virus in March in the U.S. given porous borders and a large outbreak in NY that spread across the country.
Countries and states with a high prevalence of cases may not spike after re-opening, but the science is uncertain
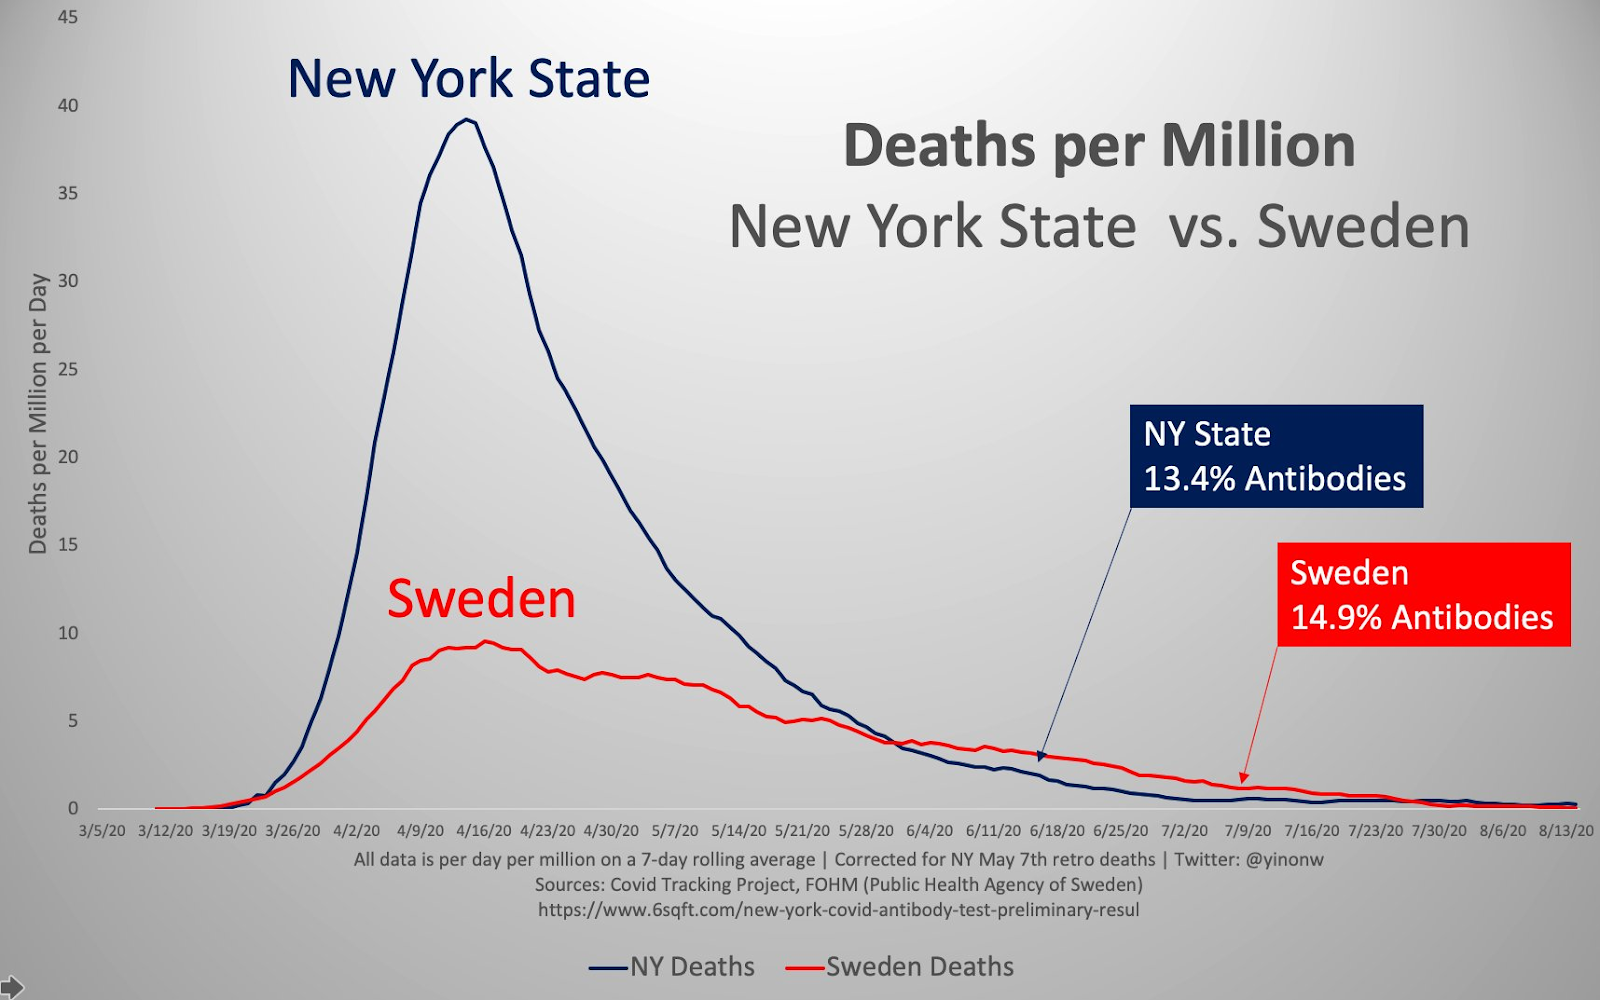
Areas like New York and Sweden and Italy that had a high prevalence of cases did not experience a large spike after re-opening. Scientists are theorizing that there is a lower threshold of 20% for herd immunity due to T-Cells immunity from this Coronavirus and pre-existing immunity from previous Coronaviruses. New York maintained strict shutdown protocols for months after its spike, with gyms for example opening next week. However, it follows the same curve as Sweden, which has had virtually no shutdown and much high mobility indices. The threshold seems to be roughly 20% of the population infected, a threshold that Florida just recently reported.
Either way, a higher prevalence in the first wave will dampen prevalence in the next wave.
Conclusions
No one knows whether COVID-19 is seasonal or how long T-Cell immunity will last. It is clear at this point that after re-opening, a six-week shutdown has the same death rate as a five-month shutdown. The length of a shutdown does not decrease the death rate, but it definitely reaps economic devastation. Government policy has swerved from a shutdown with no masks to an opening with masks.
After short shutdowns to prepare, Texas and Florida experienced only 11,000 and 12,000 deaths respectively, numbers that are similar to a bad flu season. Both states managed to quickly re-open their economies and limit unemployment increases relative to states with long shutdowns. Prior to this pandemic, if you asked an epidemiologist for the best case death rate and economic damage of a once-in-a-century pandemic, Texas and Florida’s numbers would grade an A+.